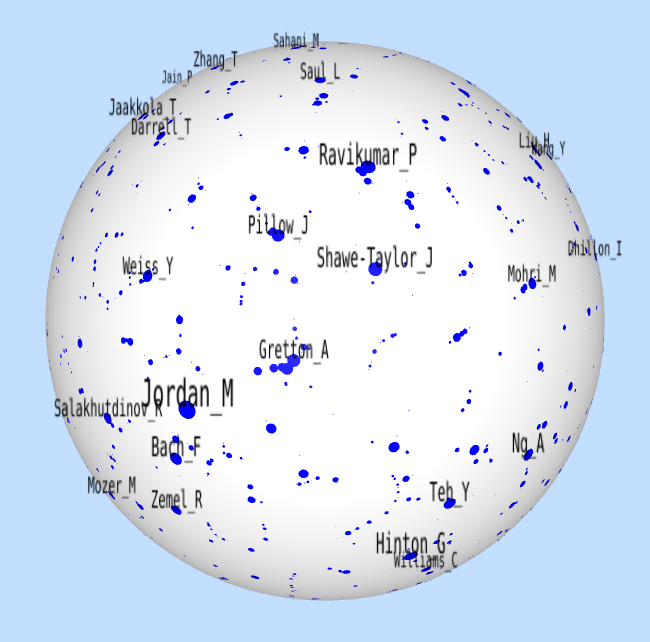
DOSNES is a new method to visualize your data.
It is based on t-SNE with two improvements:
- Doubly Stochastic Normalization
- Spherical Embedding
Why Doubly Stochastic Normalization?
t-SNE is the state-of-the-art method for data visualization. However, when the similarity graph in t-SNE has highly imbalanced node degrees, t-SNE might have an undesirable effect: the nodes of high degree are crowed in the center.
For example, in a co-author graph (NIPS), some authors have lots of papers (Michael Jordan has 93 papers) while most people only have a few. As a result, although productive authors such as Hinton and Scholkopf have never co-authored a paper, they are close in the plot, as below.
For another example, in a world trade dataset, some countries like USA and Germany have much more total imports/exports than many others. In the t-SNE visualizations, these countries are crowded in the center, as below.
A solution here is to apply doubly stochastic normalization to the similarity graph such that all the nodes have the same degree. Please see our paper below for more details.
Why Spherical Embedding?
Sometimes we like to view the world map on a globe. Although a globe can be projected on a plane, this projection would introduce distortion.

- Roughly speaking, the embedding of a doubly stochastic similarity matrix is very likely to be spherical. Please see our paper below for the proofs.
- A sphere has no center or boundary on its surface. It eliminates center and boundary effects in visualization.
- Data visualization on spherical screens.
Demo
Paper
Doubly Stochastic Neighbor Embedding on SpheresYao Lu, Jukka Corander, Zhirong Yang
Pattern Recognition Letters, 2019
Code
https://github.com/yaolubrain/DOSNES
Questions
If you have any question, feel free to contact us (yaolubrain@gmail.com). We would like to hear from you!


